Up to 5 years of tick history
Historical archives cover major FX pairs, European index futures, and select equities going back up to five years — enough to stress-test a strategy through multiple market regimes.

Backtesting
Practice of Boston's backtesting engine replays your strategy against historical tick data — so you can answer that question before you risk live capital.
Many backtesting tools use OHLC bars, which means a strategy that fires on an intrabar price level is simulated differently from how it would execute live. Practice of Boston's engine uses the same tick-level data archive that feeds your live strategies — every simulated tick is a real historical print, timestamped and sequenced exactly as it occurred. Your strategy's rule set compiles to the same executable object in both modes; the only difference is whether the event source is the live feed or the historical archive. This means a backtest result reflects genuine strategy behavior, not a bar-approximation of it. Slippage and commission parameters are configurable so you can model realistic execution costs rather than assuming perfect fills.
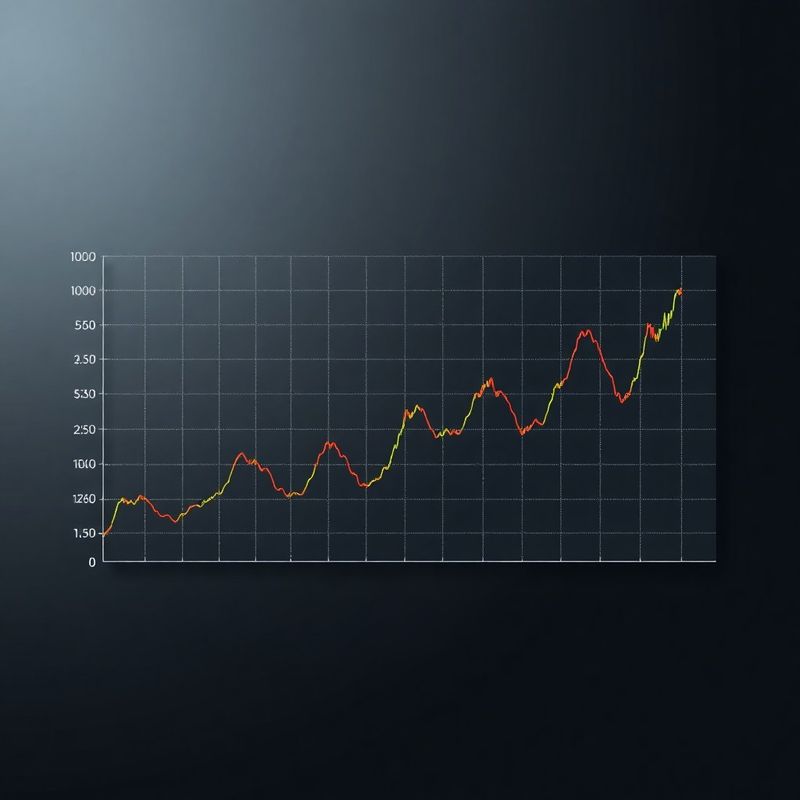
At the end of a backtest run, the terminal produces a structured performance report covering: total return and maximum drawdown over the test period; win rate, average win, and average loss per trade; Sharpe ratio calculated on daily P&L; a full trade-by-trade log with entry and exit timestamps, fill prices, and P&L per trade; and an equity curve chart rendered in the slate-professional dashboard that you can annotate and export as a PNG. You can run multiple parameter variants in sequence — for example, testing three different stop-loss distances on the same strategy logic — and compare the resulting equity curves side by side to identify which parameter set shows the most stable historical behavior.
Historical archives cover major FX pairs, European index futures, and select equities going back up to five years — enough to stress-test a strategy through multiple market regimes.
Set realistic transaction cost assumptions per instrument before running a simulation — so your backtest P&L accounts for what execution actually costs, not an ideal-fill fantasy.
Every backtest produces an annotated equity curve you can export as PNG or review interactively in the terminal — useful for sharing strategy analysis with a trading partner or mentor.
“I backtested my breakout strategy over 2022 and 2023 before going live. The results showed that my original stop-loss placement was too tight — I was being stopped out on noise. Widening it by 12 pips in the simulation produced a meaningfully better equity curve, and when I applied that change live it held up. The backtest wasn't decoration; it was actually useful.”
Peter Kovačič, FX swing trader, Nova Gorica
Your first backtest run is available on every plan — no live capital needed to explore what your strategy would have done.
See Pricing Plans